How Campaign Finance Contributions Demystify Massachusetts Elections
Campaign finance data provides a valuable and objective ground-truth to the horse race that is the political process. In Massachusetts, we can use it to understand what's happening on the ground in almost any race, in real time.
I hope you stick around. Click here to sign up to my newsletter! There's no spam, and no selling your information to the highest bidder, promise!
Polling is an unalienable part of our political process in the United States. In national elections, like for Congress or President, we look to polls and our pollsters for guidance on how populations of people otherwise inaccessible to us feel about the candidates they will choose between, and how that may tilt the balance of power. Polls are conducted on all geographic levels, from national polling down to local city and municipal elections.
Accurate polling in local elections is largely dependent on resources and reaching likely voters who may be unlikely poll respondents, especially in Massachusetts. Not reaching a representative cross section of the population means there may be an incomplete picture of the results to come, leading to surprise victories like Rep. Ayanna Pressley beating out former-Rep. Michael Capuano in 2018.
In my opinion, there are ways these political eventualities can feel less like a surprise and more rooted in on-the-ground facts. Campaign finance data is one way to demystify local elections, and create a ground truth in the absence of polling resources. And let's face it: running a political campaign is expensive, so the act of donating to a campaign can speak volumes.
When we define "campaign finance data" we are really looking for a list of individual contributors who have donated to an individual or a political action committee representing an individual. These individual contributors have to report information such as their name and address to the candidate, and it is the candidate's responsibility to file paperwork passing along the donor's information as well as the amount they've contributed to the political campaign.
If we're looking for information about Federal elections, we go to the U.S. Federal Election Commission (F.E.C.) website and search for committees/candidates, and filter the resulting spreadsheet(s) to individual contributions. If we're looking for information about State elections within Massachusetts, then we can go to the Massachusetts Office of Campaign and Political Finance (O.C.P.F.).
The 2018 MA-7 Primary Election
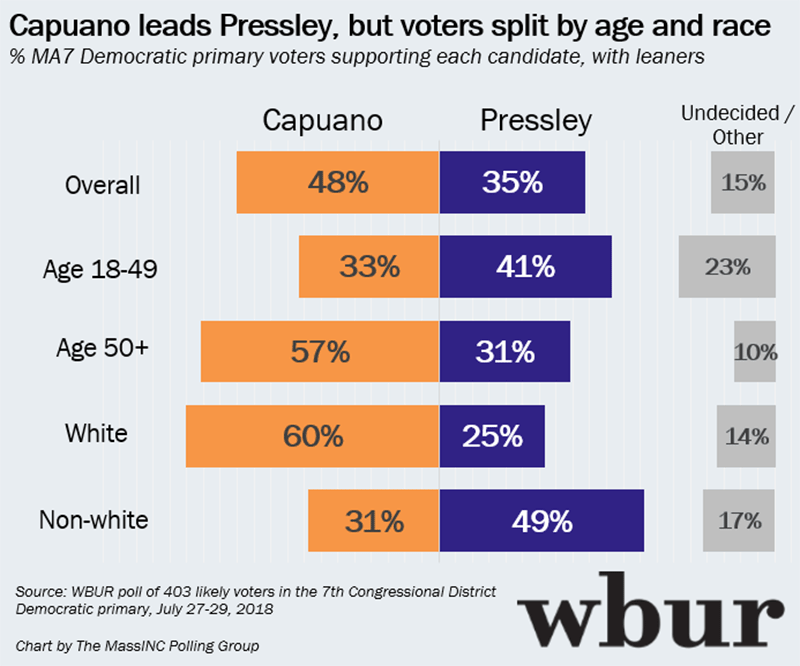
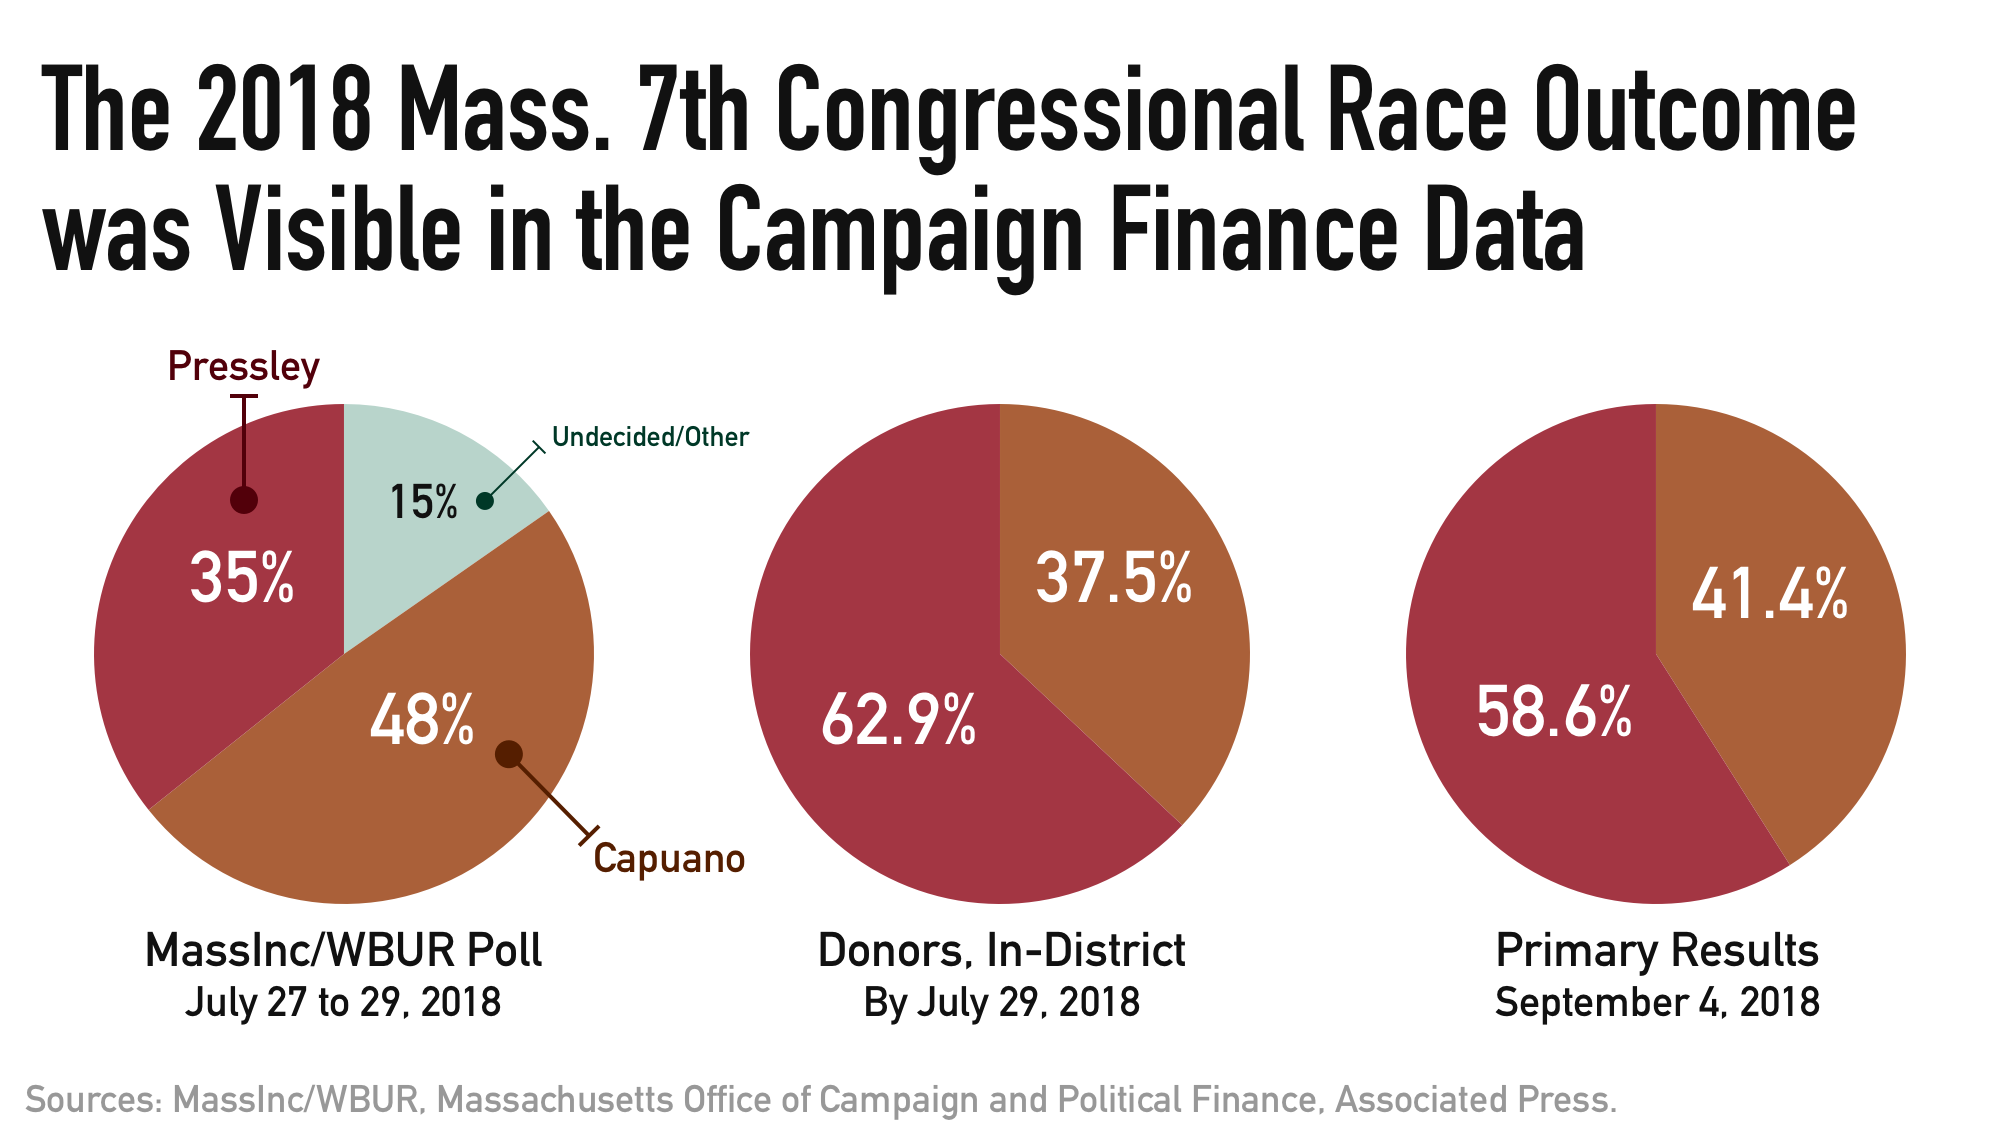
Using the 2018 election of Rep. Ayanna Pressley as an example, I can demonstrate how it really should have come as no shock that she would win the Massachusetts 7th Congressional election. The last poll of the race was conducted by MassInc. Polling Group from July 27 through 29 of 2018, with the results being released on August 2nd on WBUR. The poll showed that Capuano had a 13-point lead over Pressley, 48 percent to 35 percent, with 15 percent undecided. A 13-point lead is typically interpreted as insurmountable, and Rep. Pressley's shock to winning the seat had left no doubt that the campaign recognized this possibility going into the primary election.
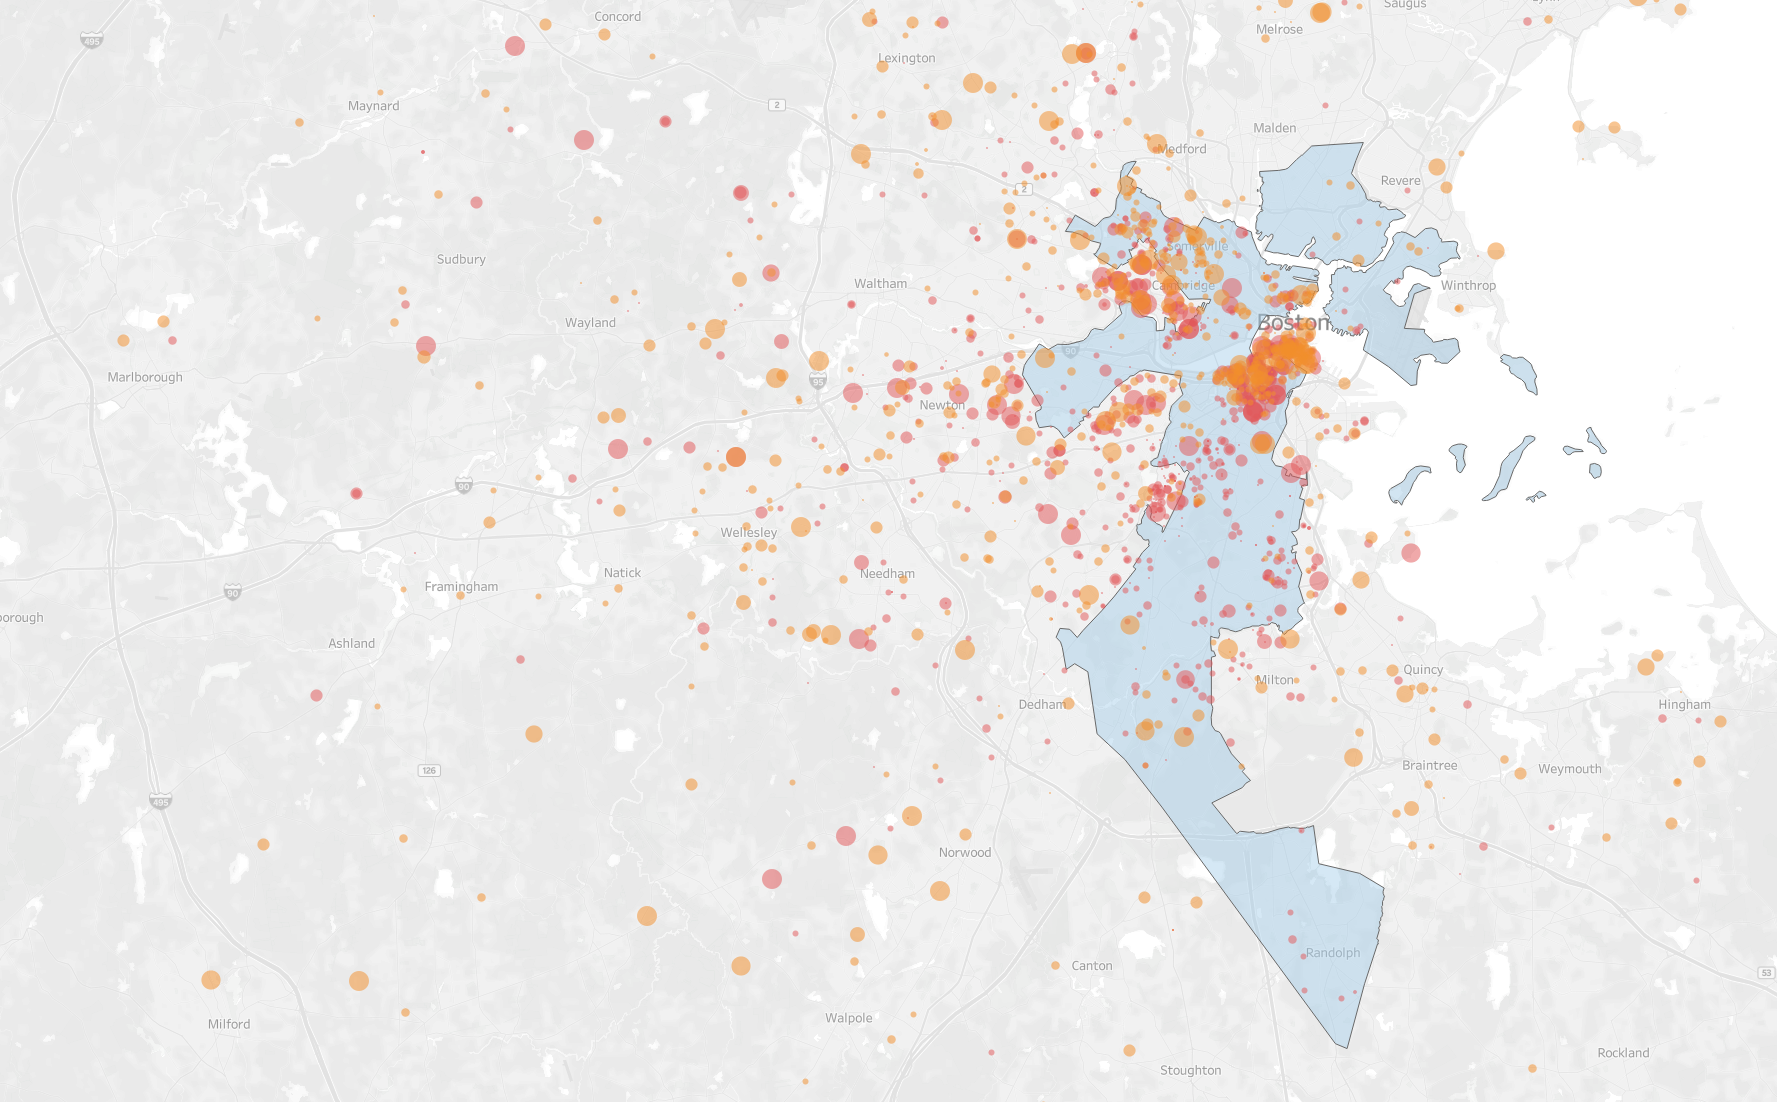
Despite this 13-point lead, the campaign finance data from the F.E.C. tells a different story. You want to temporarily put aside the dollar amounts the donations consist of, and look at the volume of donors for this analysis. If we take a donation to represent an individual's support for a candidate, then you can see that the reality is far different than the MassInc/WBUR poll. For all individuals who donated at least $1 to each of the two committee's, Pressley recevied 49.2 percent of the individuals and Capuano received 51.1 percent of individuals. That already says that the race is closer than people realize.
Now, I hope you're thinking what I did: "but Nasser, I could've donated to either candidate and still not been able to vote for them, wouldn't that change the numbers?" To that I say: "well, you're absolutely right!"
If you filter to only those donors who are within the borders of the MA 7th Congressional District, effectively retaining only those contributors who theoretically have the ability to vote for the candidate(s) in question, you paint a different picture.
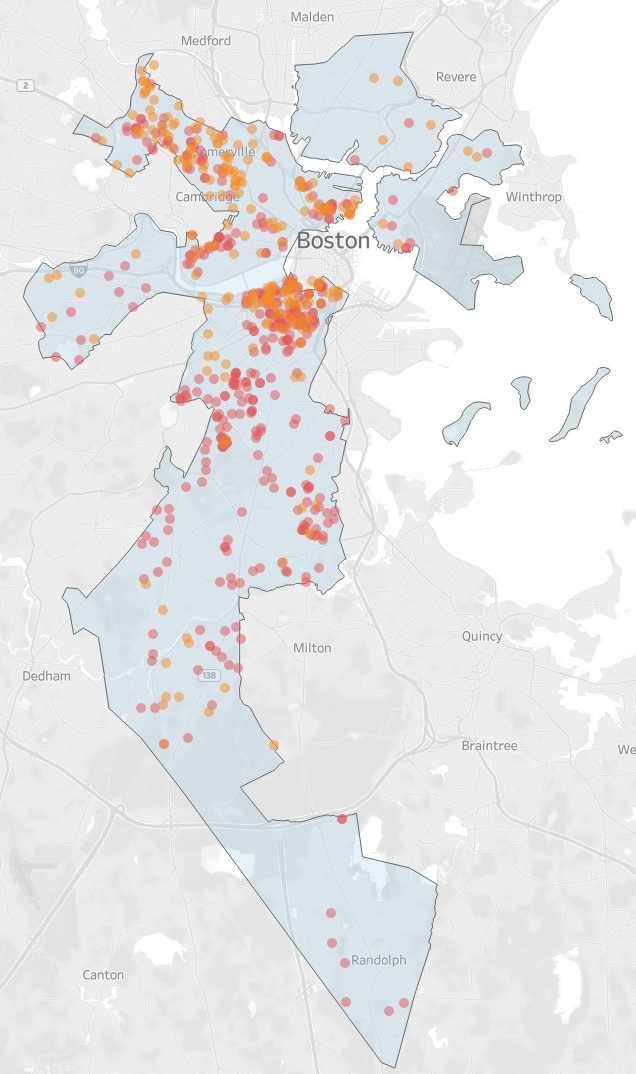
Suddenly, you find that 62.9 percent of in-district donors gave to Pressley, and 37.5 percent to Capuano. This closely resembles the primary results where Pressley received 58.6 percent of the votes to Capuano's 41.4 percent to win the primary election.
You can also underlay a layer of the percent of people living in a particular area that are Black or African American according to the U.S. Census A.C.S., to visualize how voters who identify as such may have chosen to contribute to a particular campaign (given that the contribution data does not collect any demographic information).
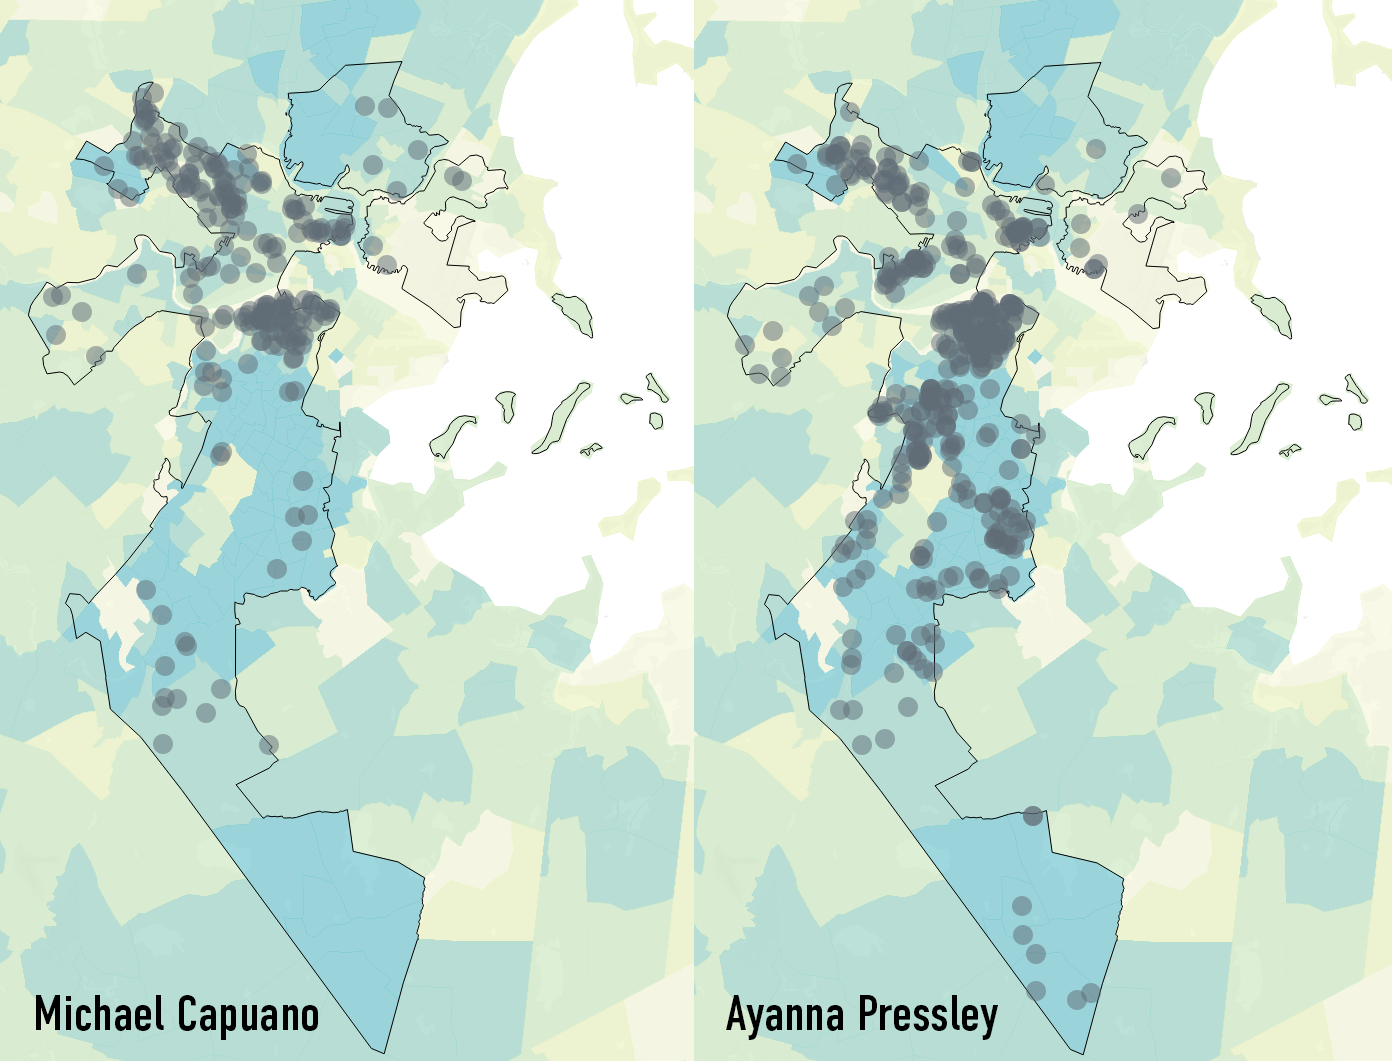
We clearly see that Rep. Pressley carried the Black donor-base in Boston, and her election and subsequent victories were undoubtedly supported by them.
As seen in the analysis above, campaign finance contributions can be an enormously useful proxy to determine how a candidate is faring within the district they are seeking office. This is especially useful in smaller jurisdictions within which opinions may rapidly form as election date approaches, or little polling has been conducted to identify voter sentiment. If the specific race you're following is even lucky to have a poll conducted, chances are it could quickly become out of date or, depending on how it was conducted, produce sampling errors showing a result that does not reflect the sentiment of the participating voters.
Looking Ahead: the 2022 Elections
There is no question that this year's upcoming election is one that will have a lasting impact for the rest of this decade and more in Massachusetts. The Globe aptly described this year as a "a banner election year," adding "are many more open seats than usual, from the state’s highest office to its most obscure, and that means a mass of bottled-up political ambition now has somewhere to go." My above analysis then begs further questions as to whether this model, that campaign finance data is in many ways an indicator of how a race is faring, is applicable in this banner election year. There are many races I can focus on, but I'll examine two local Boston-area elections.
State Senate 2nd Suffolk District
I think the election for the 2nd Suffolk District for the Massachusetts State Senate is undoubtedly one of the state's most interesting local races. First, you contend with the fact that the incumbent, State Senator Sonia Chang-Díaz, is running for Massachusetts Governor: leaving the seat wide open. Second, with the U.S. Census Bureau's 2020 decennial census fully wrapped up and Governor Baker having signed the state's new legislative maps into law on November 4, 2021, the redistricting process has changed the boundaries within an intensely segregated Suffolk County. Take a look below.
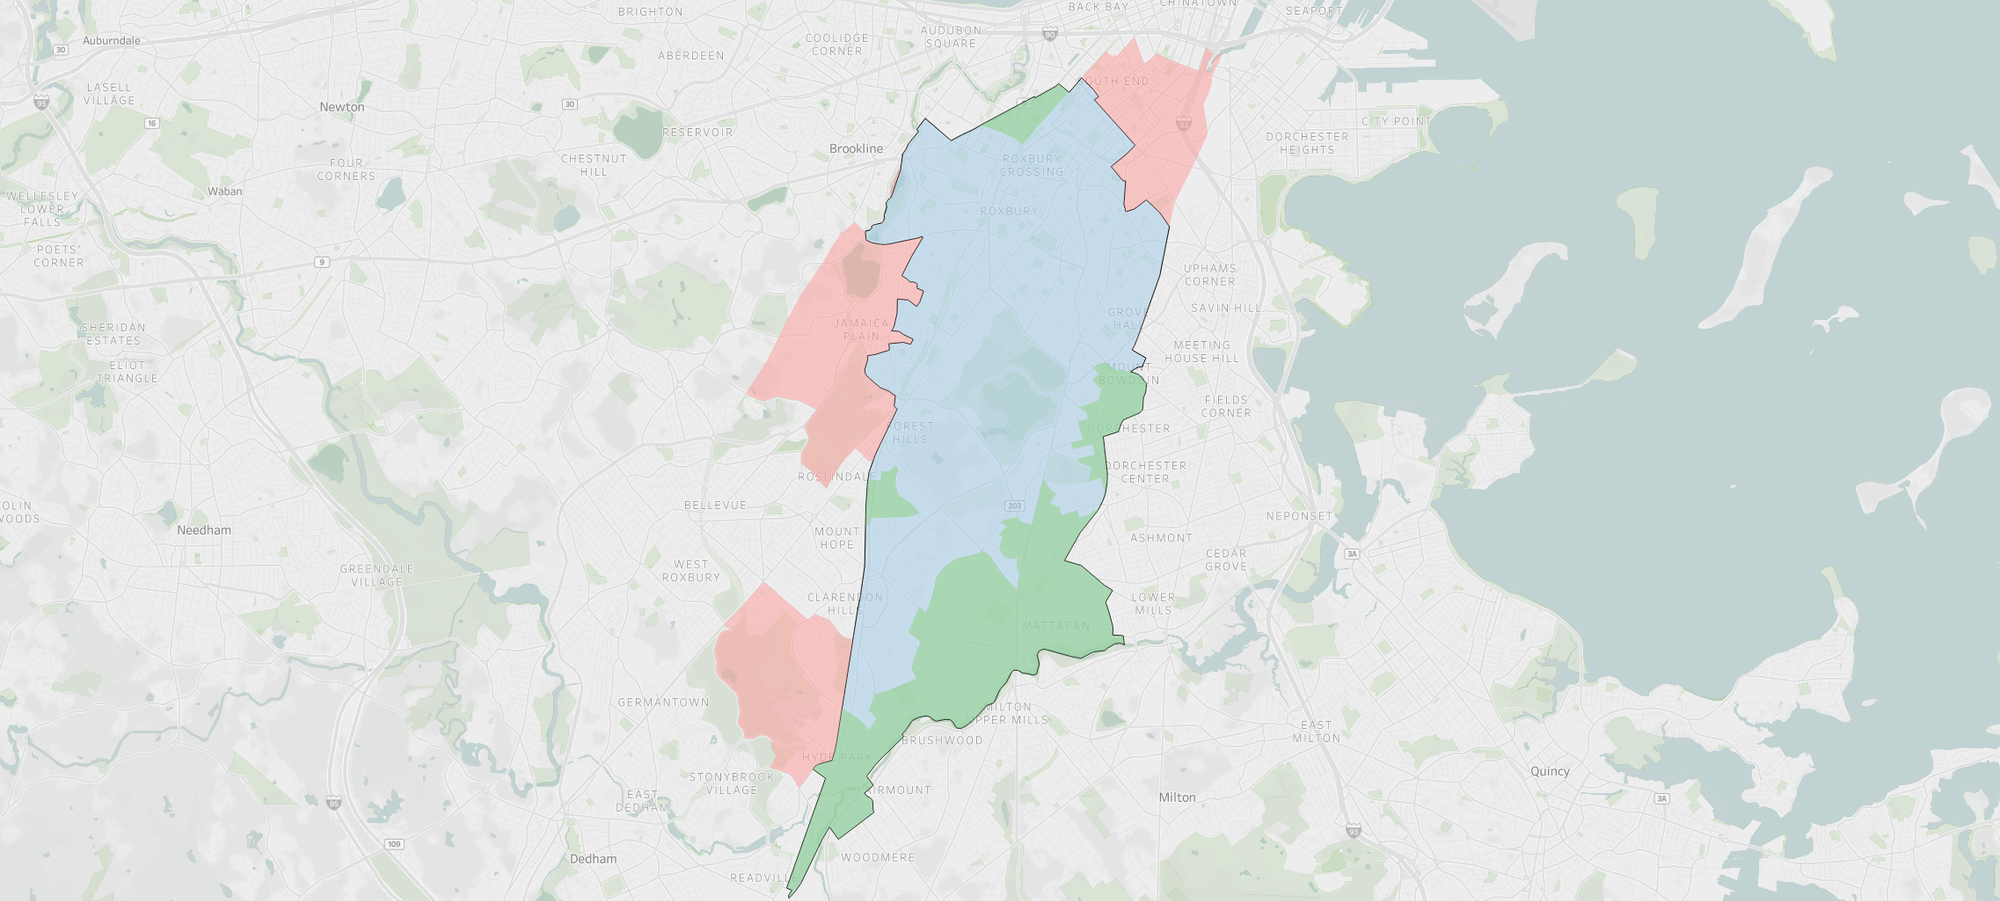
As you can see, much of the South End has been decapitated from the Second Suffolk Senate District, along with a big chunk of Jamaica Plain and a small part of Hyde Park going as well. Gained is the rest of Hyde Park, Mattapan and Bowdoin. The Second Suffolk Senate District in effect further entrenches ever so slightly into neighborhoods whose residents further identify as Black or African American.
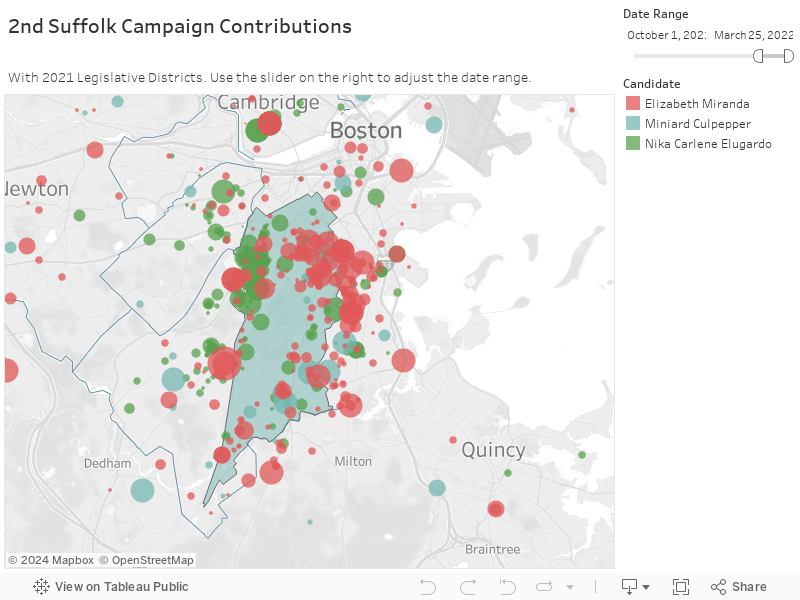
Running for the open seat are State Reps. Elugardo and Miranda, and the Rev. Culpepper. In my opinion it's too soon to say how things will pan out, so I'll aim to perform an in-district donor analysis later in the summer. But one thing remains clear, the change in district will have an interesting and measurable effect on the outcome of the election.
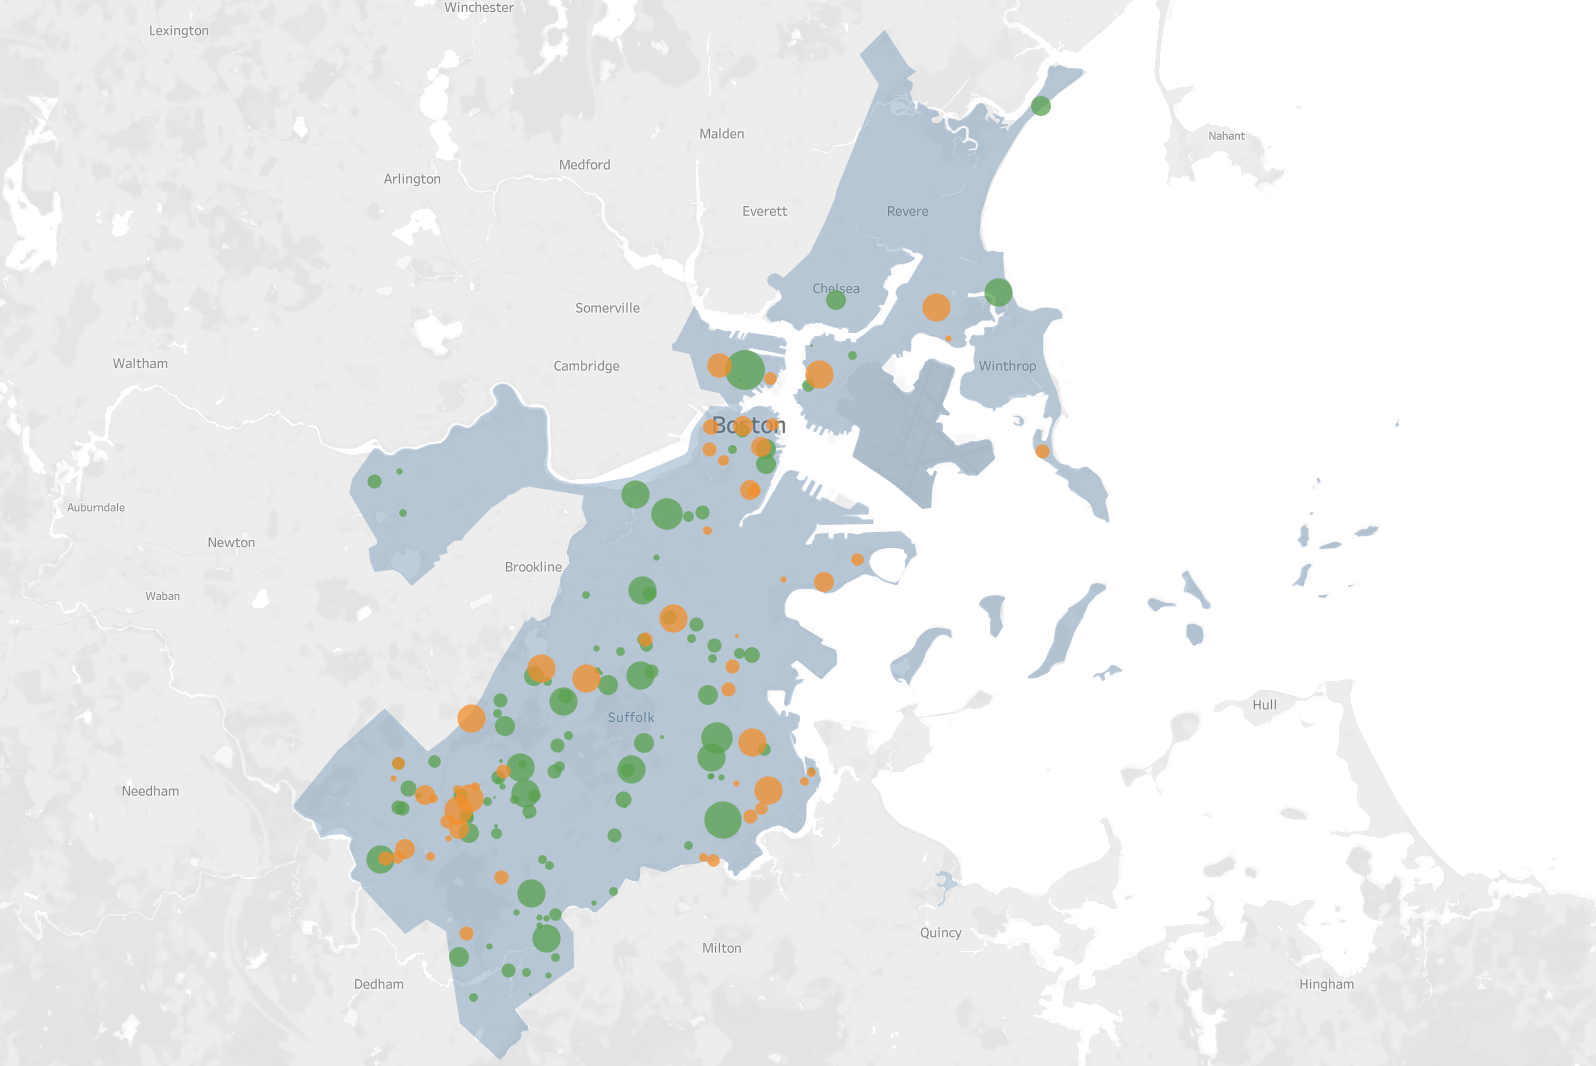
Take a look at the campaign finance contributions thus far with the interactive dashboard below. Zoom in and out, and change the date range using the slider on the left hand side.
Suffolk County District Attorney
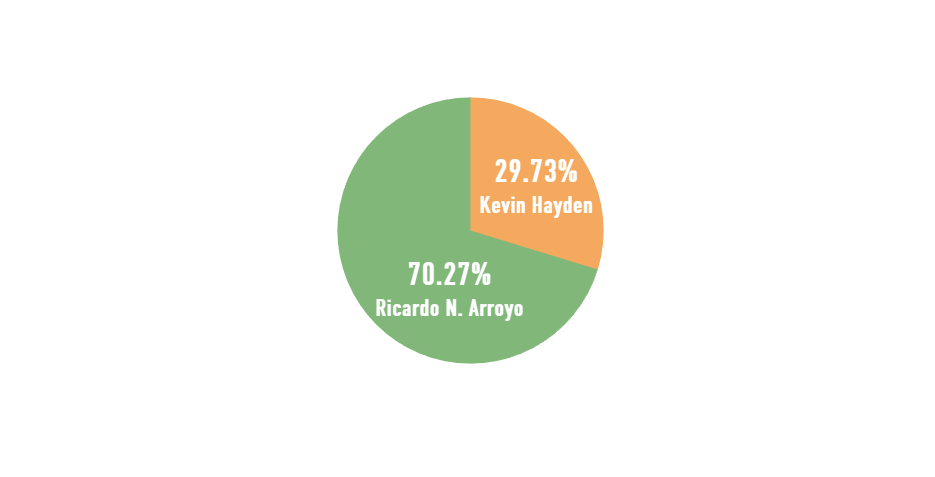
I would be remiss if I didn't discuss my former employer, the Suffolk D.A.'s office. Where in 2018 we saw a remarkable five candidates vying for the head of that office; this time around we have only two: Baker-appointed interim-D.A. Kevin Hayden, and Boston City Councilor Ricardo Arroyo. Policy-wise I have a bit more to say, but I'll save that for another time.
In terms of campaign finances, it couldn't be more lopsided at the moment. With about five months to go, Councilor Arroyo maintains a sizable lead of in-district donations compared to D.A. Hayden, with 70.27% to 29.73%.
Whether that tracks in votes remains to be seen. Besides, most of us are still emerging from our winter cocoons, and could find that the energy to engage in the political process lies still ahead of us.
At some point in the future, I will compare the 2018 and 2022 Suffolk County District Attorney elections to understand how the campaign finances have differed from election to election, and if the 2020 protests against police have had any measurable say in the coffers of District Attorney candidates.
Wrapping Up
There is no question that campaign finance data provides a valuable and objective ground-truth to the horse race that is the political process. What I've demonstrated above is only the tip of the iceberg, and in subsequent articles I'll go into some of the other types of things we can learn.
In a Commonwealth reluctant to change and insistent on maintaining bureaucratic roadblocks as an affront to technocratic governance, the level of detail found in the campaign finance data and the frequency by which it is updated provides me a modicum of comfort: this Commonwealth has the power to build technologies that improve governance structures, it just needs to find the will to do so.